Unified context
See the current state of every connected app in one overview.
PlantOps Hub brings status and events from SiloDry, ChangeFlow, StopTrack and SetupGuard into one common dashboard so production teams can see what happened before, during and after a loss.
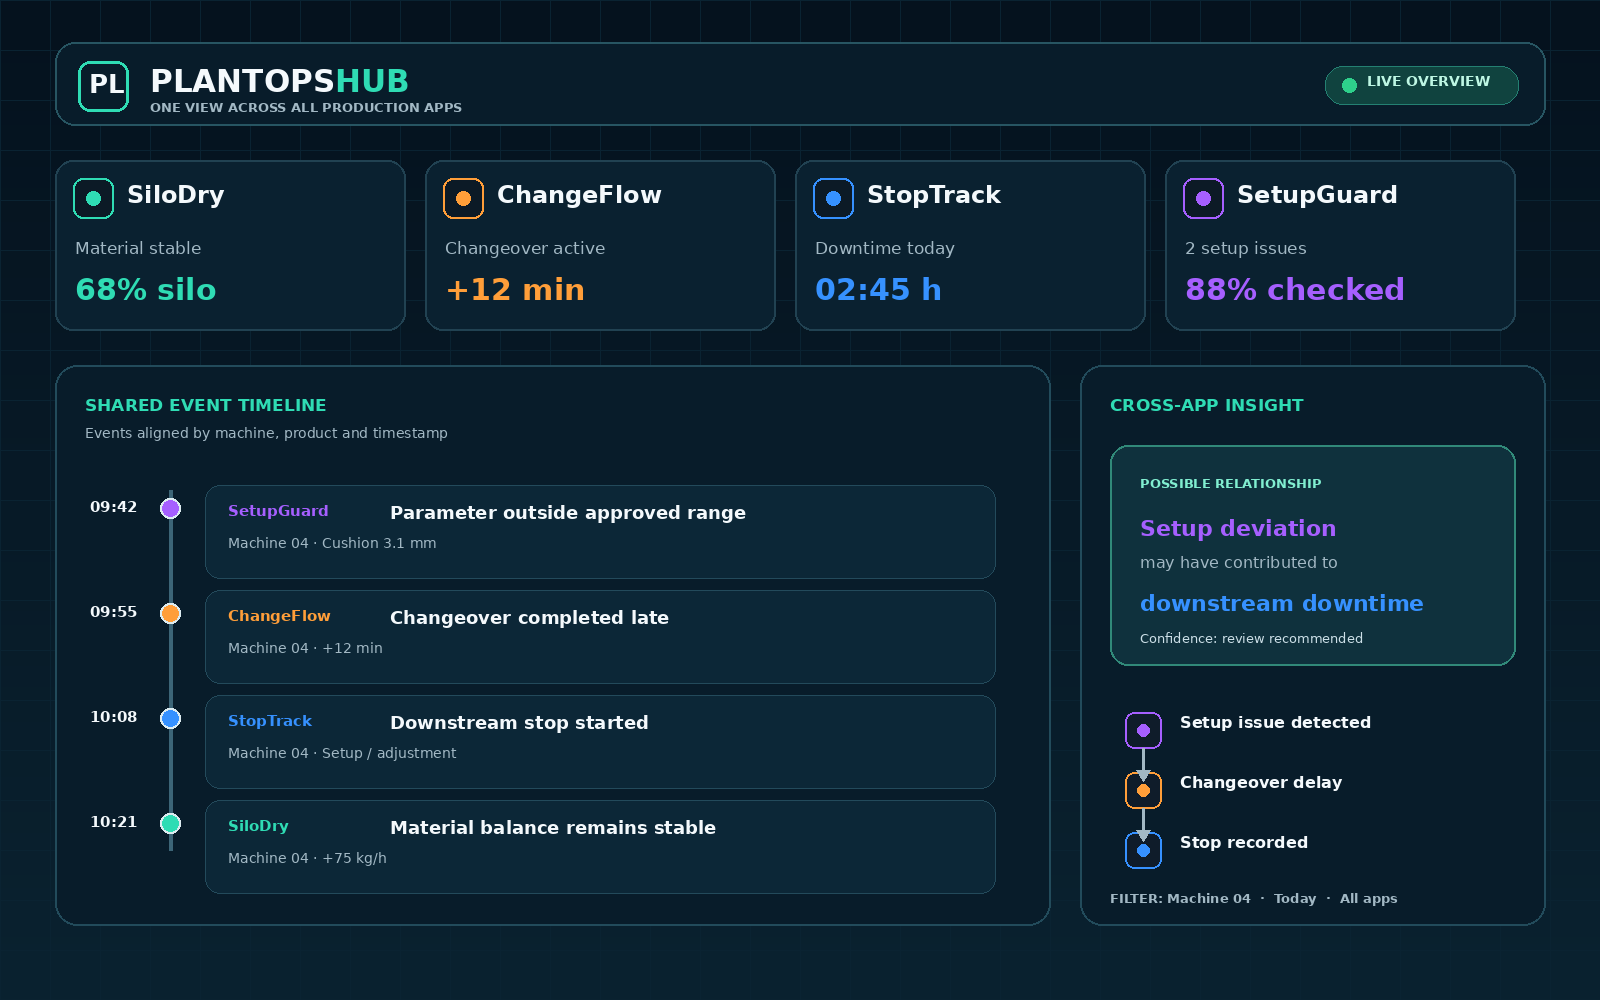
A setup deviation, a delayed changeover and a downstream stop may be related, but those signals are easy to miss when every workflow lives in a separate screen. PlantOps Hub aligns them by machine, product and time.
See the current state of every connected app in one overview.
Review events from all apps in chronological order.
Highlight sequences that deserve an engineering review.
Use Hub with any PlantOps Lab apps included in the customer licence.
Match machine, product, shift and timestamp across events.
Filter the timeline and inspect possible cross-app patterns.
No. The first version highlights possible relationships for human review; it does not claim automatic root-cause certainty.
No. Hub works with any combination of purchased PlantOps Lab applications.
The first direction uses data generated by the PlantOps Lab apps. Future integrations can be evaluated separately.
Live status, a common event timeline, key alerts and filters by machine, product and shift.
Join early access and tell us which three metrics, alerts or relationships should appear first.